
News
Top 10 agribusiness giants: Corporate concentration in food & farming
By Grain et ETC Group
Published on the 14/09/2026, modify the 15/09/2026


In times of war, market concentration allows companies to reap even greater profits, while farmers and consumers around the world suffer from rising fertilizer and food prices. This report provides a snapshot of the state of concentration in the agri-food sector. It follows up on the 2025 edition and assesses the state of market concentration in six key agricultural sectors: commercial seeds, pesticides, synthetic fertilizers, agricultural machinery, veterinary pharmaceuticals, and livestock genetics.
Inf’OGM is publishing here the results of a study by GRAIN and the ETC Group on industrial concentration in six key sectors of the agri-food industry. This report unequivocally demonstrates the concentration of several markets in the agri-food sector in the hands of a few multinational corporations. The report reproduced below is an update to a previous version from 2025. It was posted online on July 29, 2026, on the ETC Group website and on July 30 on the GRAIN website. All 115 references provided by the organizations to support their report are available in their original versions on their websites.
Why corporate concentration in the food system matters
Just five years ago, the COVID-19 pandemic and the Russian invasion of Ukraine disrupted food supply chains and drove up food prices. Today, another food crisis is looming. The Israeli-US war on Iran has already had devastating consequences for the local population and environment. Along with disruption to the oil markets and other geopolitical dynamics, it is also pushing up the prices of fertilisers and food.
Taking advantage of the food system’s dependence on nitrogen fertiliser, the world’s largest nitrogen fertiliser companies systematically increased their margins during the natural gas supply shocks caused by both wars. For instance, by the third month of the war on Iran, CF Industries Holdings Inc., Nutrien Ltd and Yara were reporting quarterly sales increases of between 19% and 40%. This translated into even higher prices for farmers and eventually consumers around the world, particularly in the Global South. Less than three weeks after the war started, the UN was already warning that an additional 45 million people could be pushed into acute hunger.
However, pandemics and wars are not the only causes of supply shocks across the food system. The climate crisis is increasing the frequency and effect of shocks, including the historic intensification of El Niño predicted for late 2026. The globalised food system, with its long supply chains and uniformity, is extremely vulnerable to such events. It is also vulnerable to corporations that exploit their monopoly power to extract more and more profit during times of volatility, at the expense of farmers, food workers, consumers and the planet.
At a moment where we need to be reining in corporate power in the food system, developments in digitalisation and artificial intelligence (AI) threaten to make it even worse. All the big agricultural input firms are pushing farmers into using their digital farming platforms as a way to increase their sales and lock-in customers. These platforms, like Bayer’s Climate FieldView, Syngenta’s Cropwise and Corteva’s Granular, enable the input companies to collect data from participating farms and farmers, and then use this data to sell the farmers more of their products.
Developments in digitalisation are also driving a convergence with powerful tech companies. Many of the largest seed, pesticide, fertiliser and machinery companies are partnering with tech giants like Microsoft, Google, Amazon and Meta. These big tech companies are rolling out digital agriculture programmes across the Global South through government programmes that farmers rely on for subsidies, inputs and other extension services. For example, the Indian government’s new digital database, Agri Stack, gives Microsoft detailed information on 80 million Indian farmers, and is being used by the World Bank as a model for programmes in other countries as well.
This report provides a snapshot on the state of agribusiness concentration. It updates our 2025 report to lay out the state of concentration in six key agricultural sectors: commercial seeds, pesticides, synthetic fertilisers, farm machinery, animal pharmaceuticals and livestock genetics. Another key sector – agricultural commodity traders – is covered in ETC Group’s 2026 report, Grain Traders, Greed and Oligopoly Power.
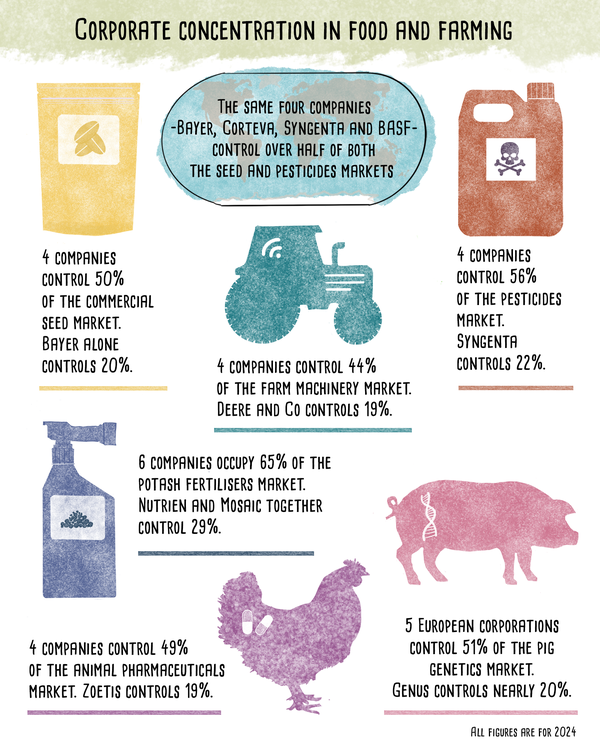
As can be seen, concentration across all six sectors remains high. Five of them – seeds, pesticides, machinery, animal pharma and pig genetics – meet the definition of an oligopoly, in which four companies control more than 40% of a market. So too does the global market for phosphate fertilisers. While the world grapples with the climate and biodiversity crises, rising hunger levels, geopolitical conflict and another looming food crisis, a handful of large companies continue to hold enormous power over our food system.
The situation is severe. We urgently need to find ways to dismantle corporate power and build food systems free from fossil fuels and corporate inputs, that provide diverse, nutritious and abundant food, dignified livelihoods and healthy ecosystems.
Commercial Seeds
The commercial seed sector refers to crop seeds (primarily proprietary field crop and vegetable seeds, including those that are genetically modified) sold via the commercial market. Farmer-saved seed and seed supplied by governments and public institutions are not included.
The top four companies that control the commercial seed sector remain the same as in 2023. Bayer, Corteva, Syngenta and BASF together account for half of the seed market, and Bayer alone accounts for 20%. These same four companies also account for 56% of the pesticides market. Overall, the commercial seed market has grown slightly in 2024 from the year before, but concentration in the sector remains similar, with the top four companies controlling 50% and the top 10 controlling 63% of the market (see Table 1).
Big commercial seed companies continue to focus on genetically engineered crops, and are pursuing new varieties through gene editing. Bayer and Corteva each have multi-year partnerships with gene editing company Pairwise, for use of its CRISPR-based platform. Similarly, Syngenta entered a partnership in 2025 with gene editing company Tropic Biosciences to develop gene-edited vegetables.
The big seed companies are also pursuing collaborations with tech companies to develop AI models for plant breeding and genetic engineering, often called “GenBio”. Bayer claims the use of AI will enable it to “write new genetic combinations” and to shorten the process of breeding new seeds from 5-6 years to just a few months. Corporate interest is driving a rush for data to train these AI models. The data is being pulled from public databases and other public information, and even from ecosystems (soils, plants and seeds), without any consultation, consent or compensation to the communities from whom this information is being stolen.
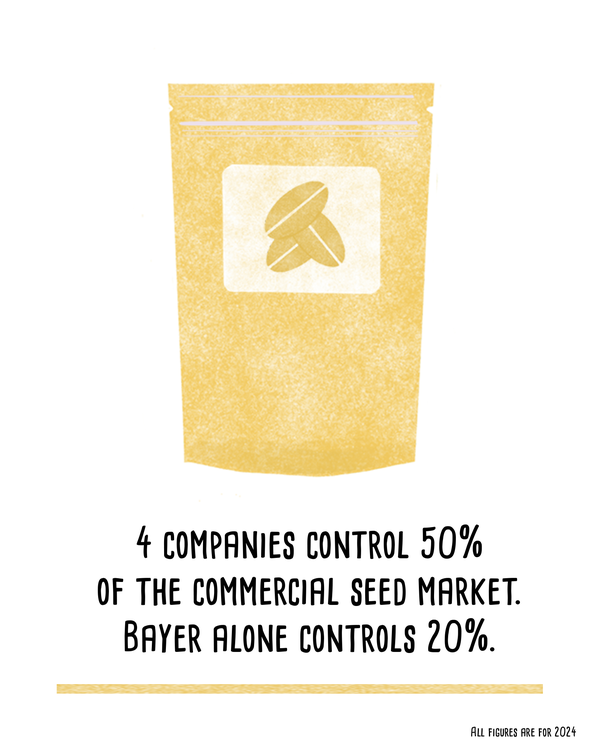
Table 1. Top 10 corporations in the commercial seed sector
| Ranking | Company (Headquarters) | Sales in 2024 (US$ millions) | % Global market share |
|---|---|---|---|
| 1 | Bayer (Germany) | 11,242 | 20 |
| 2 | Corteva Agriscience (US) | 9,545 | 17 |
| 3 | Syngenta (China/Switzerland) | 5,074 | 9 |
| 4 | BASF (Germany) | 2,292 | 4 |
| Total top 4 | 28,153 | 50 | |
| 5 | Groupe Limagrain (France) | 2,058 | 4 |
| 6 | KWS (Germany) | 1,815 | 3 |
| 7 | Yuan Longping (China) | 1,191 | 2 |
| 8 | DLF Seeds (Denmark) | 798 | 1 |
| 9 | Rjik Zwaan (Netherlands) | 740 | 1 |
| 10 | Sakata Seeds (Japan) | 600 | 1 |
| Total top 10 | 35,355 | 63 | |
| Total world market | 56,000 | 100 |
Pesticides
The pesticides sector includes herbicides, insecticides and fungicides, which are different types of agrochemical products that target weeds, insects and fungi, respectively.
The top four companies that control the commercial pesticide sector remain the same as in 2023. Syngenta, Bayer, BASF and Corteva together account for 56% of the pesticide market in 2024. These same four companies also account for half of the seed market. The top 10 pesticide companies control a whopping 78% of the total market (see Table 2).
The pesticide sector’s legal woes continue. For the last decade, Monsanto (now owned by Bayer) has been fighting over 100,000 lawsuits brought by people who developed Non-Hodgkins Lymphoma that they blame on exposure to glyphosate-based herbicides like Roundup. Syngenta is facing lawsuits from people who allege they contracted Parkinson’s disease after exposure to the pesticide paraquat. In 2026, the company announced that it would stop global production of paraquat.
The pesticide industry has responded to these legal battles by lobbying for legal immunity to future lawsuits. In February 2026, Bayer announced a class action settlement for US$7.25 billion to settle thousands of cases it was facing, but a judge later called the settlement “legally problematic”, describing it as a “filthy deal” that was filed in a secretive and hasty manner.Within two days, US president Donald Trump announced an executive order to protect the production of glyphosate-based herbicides and to seek immunity for companies producing glyphosate. In June 2026, the US Supreme Court ruled in favour of Monsanto in a decision that will block or limit thousands of current and future lawsuits against the company.
These costly legal fights have forced companies to rethink their business models. Corteva is in the process of splitting itself into a seed company called Vylor and a pesticides company called New Corteva. This decision to “unbundle” its divisions helps Corteva insulate its seed business from the possible legal liabilities that it and other pesticide manufacturers increasingly face. In a 2025 presentation to investors, Bayer did not include glyphosate in its core pesticide business projections, as it will be managing glyphosate as a separate business from the rest of its core pesticide platforms.
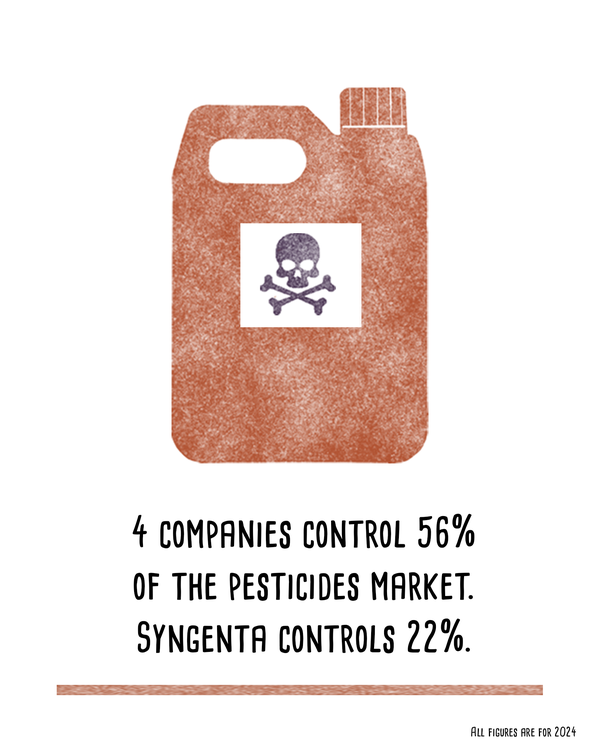
Table 2. Top 10 corporations in the pesticide sector
| Ranking | Company (Headquarters) | Sales in 2024 (US$ millions) | % Global market share |
|---|---|---|---|
| 1 | Syngenta (China/Switzerland)[30] | 17,014 | 22 |
| 2 | Bayer (Germany) | 11,101 | 14 |
| 3 | BASF (Germany) | 8,308 | 11 |
| 4 | Corteva Agriscience (US) | 7,363 | 9 |
| Total top 4 | 43,786 | 56 | |
| 5 | UPL (India) | 4,543 | 6 |
| 6 | FMC (US) | 4,250 | 5 |
| 7 | Sumitomo (Japan) | 3,742 | 5 |
| 8 | Nufarm (Australia) | 1,938 | 2 |
| 9 | Shandong Weifang Rainbow Chemical (China) | 1,848 | 2 |
| 10 | Sino-Agri Leading Biosciences Co (China) | 1,452 | 2 |
| Total top 10 | 61,560 | 78 | |
| Total world market | 78,000 | 100 |
Synthetic Fertilisers
Chemical (or synthetic) fertilisers are a key and toxic component of industrial agriculture. The most widely applied are nitrogen-based fertilisers, accounting for up to 57% of global use, followed by phosphate fertilisers (23%) and potassium-based (potash) fertilisers (20%), according to the industry. Nitrogen fertilisers are highly dependent on fossil fuels, accounting for 7% of total emissions from the industrial food system and 60% of global anthropogenic nitrous oxide emissions.
The global fertiliser market was estimated at over US$221 billion in 2024. The top 10 largest corporations had a combined revenue of US$68 billion (see Table 3). The amount would likely be higher if Eurochem was included, since it is a top fertiliser company that does not report its revenue. Sales for many of the top companies have declined from 2023, largely due to the fact that several fertiliser companies saw their profits soar during the first year of the war in Ukraine. Compared with 2023, revenues at seven of the top ten companies fell by between 4% (Sinofert) and 21% (OCI). The only companies that saw increased sales were Uralkali (1%), PhosAgro (7%) and OCP (11%). Overall, however, revenues of the 10 largest fertiliser companies remain 26% higher than in 2020, and reporting from the nitrogen fertiliser companies for the first three months of 2026 shows that they, at least, are now profiting handsomely from the US-Israel war on Iran.
There is a significant level of corporate concentration in this sector. The top 10 companies control up to 31% of the market. But, depending on the type of fertiliser, this share can be even higher. Just four companies (Nutrien, Mosaic, OCP and ICL) control 25% of the global phosphate fertiliser market, and six firms (Nutrien, Mosaic, ICL, Uralkali, K+S and Eurochem) together account for 65% of the total volume of potash fertilisers sold.
A notable trend on the African continent is the surge in investment from the Gulf region into the fertiliser industry. For example, Ma’aden, a Saudi Arabian company, is one of the leading suppliers of phosphate fertiliser to Africa, accounting for 40% of imports to Zambia and Zimbabwe in 2023. Emirati and Saudi companies have also increased their investments in fertiliser production. In Egypt, Saudi Arabia and Abu Dhabi’s sovereign wealth funds together control over 40% of two of the country’s largest nitrogen fertiliser producers. Fertiglobe (UAE) has facilities in Egypt, Algeria and South Africa and claims to be the largest nitrogen fertiliser producer in the Middle East and North Africa. SABIC (Saudi Arabia) owns a 49% stake in ETC Holdings, a subsidiary of the Mauritius-based Export Trading Group (ETG), a leading fertiliser trader in several African countries.
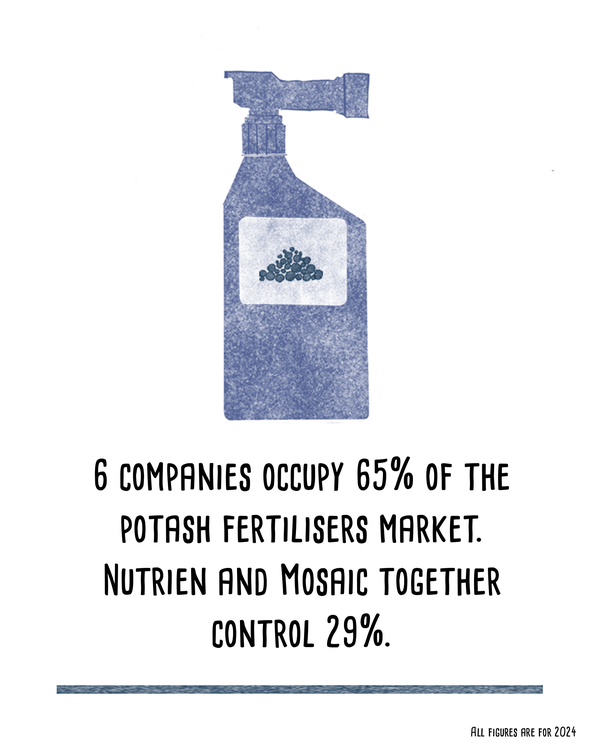
Table 3: Top 10 corporations in the synthetic fertilisers sector
| Ranking | Company (Headquarters) | Sales in 2024 (US$ millions) | % Global market share |
|---|---|---|---|
| 1 | Nutrien (Canada) | 13,725 | 6 |
| 2 | The Mosaic Company (US) | 10,587 | 5 |
| 3 | Yara (Norway) | 10,306 | 5 |
| 4 | OCP (Morocco) | 6,606 | 3 |
| Total top 4 | 41,224 | 19 | |
| 5 | CF Industries Holdings, Inc. (US) | 5,936 | 3 |
| 6 | ICL Group Ltd. (Israel) | 5,443 | 2 |
| 7 | PhosAgro (Russia) | 5,319 | 2 |
| 8 | Uralkali (Russia) | 3,546 | 2 |
| 9 | OCI (Netherlands) | 3,318 | 1 |
| 10 | Sinofert (China) | 2,956 | 1 |
| Total top 10 | 67,742 | 31 | |
| Total world market | 221,450 | 100 |
Farm Machinery
The farm machinery sector includes equipment used in agriculture, such as tractors, haying and harvesting machinery, and equipment used for planting, fertilising, ploughing, cultivating, irrigating and spraying. As farm equipment companies move towards digitalisation and automation, this sector can also include their proprietary digital platforms, drones, and robotic technologies.
The top four companies in this sector remain the same as in 2023, and collectively account for 44% of the market. They continue to focus on integrating AI and digital platforms into their machinery. Together, the top 10 companies in the agricultural machinery sector control 53% of the market, and the largest – Deere & Company – alone accounts for 19% (see Table 4).
Agricultural machinery companies are increasingly defining themselves as technology firms rather than just machinery manufacturers. They see their future profits coming less from selling equipment like tractors and combines, and more from controlling the digital platforms and infrastructure installed in them. These digital tools are built through partnerships with seed and pesticide companies, as well as telecom, cloud computing, data storage and other tech companies.
The integration of digital technology in agricultural equipment has changed the ways in which farmers can operate, repair and prolong the lifespan of their machinery. For thousands of years, farmers have built and repaired their own tools and machines. Now, large agricultural machinery companies are designing their equipment so that it can only be repaired by specialised dealers using proprietary replacement parts. Farmers, especially in the Global North, who try to fix their machines themselves risk being locked out of their equipment or having their warranties voided.
Farmers are resisting these measures and calling on governments to instate Right to Repair legislation that puts farmer autonomy before corporate profits, and ensures that “goods, owned or leased, are repairable at a reasonable price, within a reasonable time-frame by the owner or a repair service of the owner’s choice”.
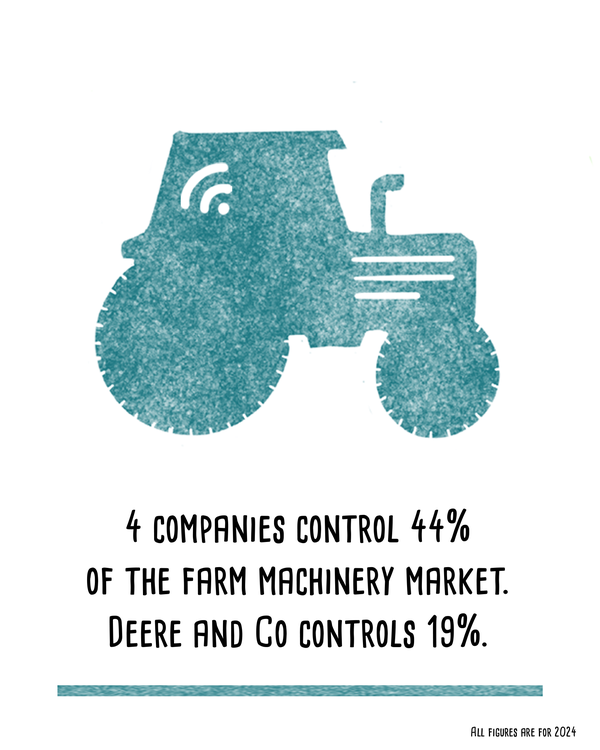
Table 4: Top 10 corporations in the farm machinery sector
| Ranking | Company (Headquarters) | Sales in 2024 (US$ millions) | % Global market share |
|---|---|---|---|
| 1 | Deere & Company (US) | 31,803 | 19 |
| 2 | Kubota (Japan) | 17,429 | 10 |
| 3 | CNH Industrial (UK/Netherlands) | 14,007 | 8 |
| 4 | AGCO (US) | 11,662 | 7 |
| Total top 4 | 74,901 | 44 | |
| 5 | CLAAS (Germany) | 5,574 | 3 |
| 6 | Mahindra and Mahindra (India) | 3,532 | 2 |
| 7 | SDF Group (Italy) | 1,772 | 1 |
| 8 | YTO Group (China) | 1,523 | 0.9 |
| 9 | Kuhn Group (Switzerland) | 1,317 | 0.8 |
| 10 | Iseki Group (Japan) | 1,113 | 0.7 |
| Total top 10 | 89,732 | 53 | |
| Total world market | 170.000 | 100 |
Animal pharmaceuticals
The mass industrial production of cattle, chickens, pigs, shrimp and salmon makes these animals vulnerable to diseases. The sector therefore depends heavily on antibiotics, vaccines, vitamins, diagnostics, medical services, nutritional supplements (such as medicated feed) and other veterinary services.
The global animal pharma market was valued at US$50 billion in 2024, including both livestock and pets. Corporate concentration is high, with the top 10 companies controlling almost 70% of the market. Zoetis alone controls one-fifth of the market (see Table 5).
The share of products for livestock compared to those for pets varies between companies. It is particularly high at Phibro (75%), Ceva (72%), Merck & Co. (59%), Huvepharma (59%), and Elanco (51%). Within the livestock sector, the main customers are large-scale farms, particularly in the US, which accounts for half of the global sales of animal pharmaceuticals.
The market share can be significant, depending on the animal. For example, Zoetis, Ceva, Boehringer, Elanco and Phibro together control 65% of the global poultry pharmaceuticals market.
Animal health supply chains in the US and Europe – where all the top 10 companies are based – rely heavily on China for raw materials, such as vitamins, amino acids and active pharmaceutical ingredients. Zoetis, Boehringer, Virbac and Ceva all have manufacturing facilities in China, some in partnership with local companies. China has a large animal pharmaceuticals market as well, worth US$9.5 billion in 2024, along with large animal pharmaceutical companies, like China Animal Husbandry Industry Co., Ltd. (CAHIC), Tianjin Ringpu Bio-Technology Co., Ltd., and Shandong Sinder Technology Co., Ltd., that are also active in Africa and other parts of Asia.
AI is used by animal pharmaceutical companies to accelerate laboratory research, enable real-time animal monitoring and provide predictive diagnostics and disease outbreak models. To train and feed its generative AI models, Zoetis is collecting masses of livestock genotype data through its testing programmes, including via access to Danone’s global dairy supply chain. Zoetis is also acquiring Neogen’s animal genomics business, which includes proprietary biological data assets from the US, Brazil, Australia, China and the UK.
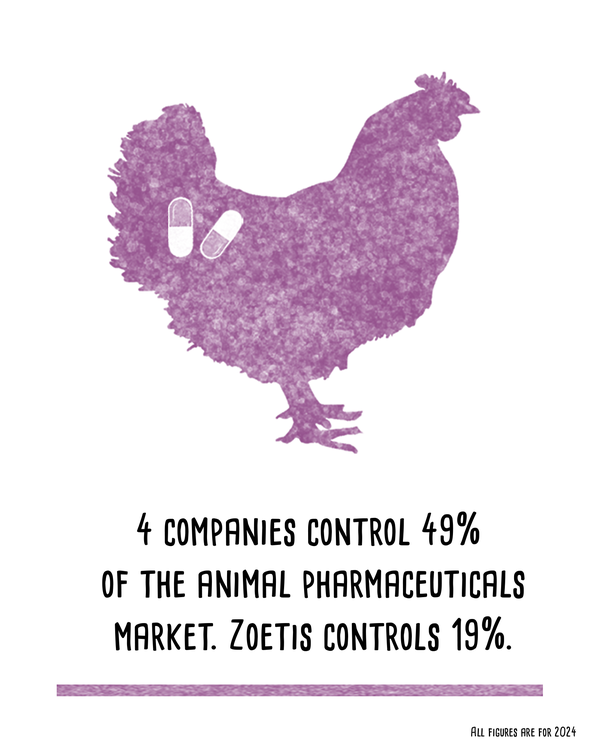
Table 5. Top 10 corporations in the animal pharmaceuticals sector
| Ranking | Company (Headquarters) | Sales in 2024 (US$ millions) | % Global market share |
|---|---|---|---|
| 1 | Zoetis (US) | 9,256 | 19 |
| 2 | Merck & Co (US) | 5,877 | 12 |
| 3 | Boehringer Ingelheim Animal Health (Germany) | 5,138 | 10 |
| 4 | Elanco (US) | 4,439 | 9 |
| Total top 4 | 24,710 | 49 | |
| 5 | Idexx Laboratories (US) | 3,696 | 7 |
| 6 | Ceva Santé Animale (France) | 1,904 | 4 |
| 7 | Virbac (France) | 1,512 | 3 |
| 8 | Dechra (UK) | 1,002 | 2 |
| 9 | Huvepharma EOOD (Bulgaria) | 900 | 2 |
| 10 | Phibro Animal Health Corporation (France) | 706 | 1 |
| Total top 10 | 34,430 | 69 | |
| Total world market | 50,000 | 100 |
Livestock Genetics
From livestock farming to aquaculture, industrial animal production is rooted in corporate control over genetics through breeding material and reproductive technologies. In the previous edition of the “Top 10 Agribusiness Giants”, we highlighted the poultry genetics market, which is dominated by just three companies: Tyson Foods (US), EW Group (Germany) and Hendrix Genetics (Netherlands). Here, we will look at two other species that are particularly significant in terms of global consumption: pig and shrimp.
In 2024, global pig production was 125.1 million tonnes, making it the second most produced meat after poultry. China, the EU, the US and Brazil together account for 77% of global production. The world pig genetics market was valued at US$2.2 billion, with just five European companies controlling half of it (see Table 6). With the exception of Genus plc, they are all privately held. According to Hendrix Genetics, 15% of the world’s pigs come from its breeding programmes, and some estimate that Genus plc’s pedigree herds sire a third of the world’s commercially farmed pigs.
At a national level, Axiom Group claims to hold half of the French market, while Topigs Norsvin holds 34% of the Brazilian market. China counts on domestic genetics companies, and aims to be self-sufficient by 2035. Large Chinese pig producers such as Smithfield Foods (WH Group) use their own genetic lines. But Genus plc, Topigs Norsvin, DanBred and Genesus are important suppliers to the country, with nucleus farms and royalty-based contracts with large integrators. For example, in 2024, Topigs Norsvin and China’s largest pig producer, Muyuan Foods, launched a joint venture nucleus farm.
As with seeds and other animals, the gene editing of pigs has drawn strong criticism from the scientific community and civil society due to concerns about its impact on health and the environment. But companies are pushing to bring GM animals to market. Genus plc’s gene edited, disease-resistant pig has been approved in the US, Canada, Colombia, Brazil, the Dominican Republic and Argentina. The company expects similar authorisations in other Latin American countries and is seeking approval in China as well.
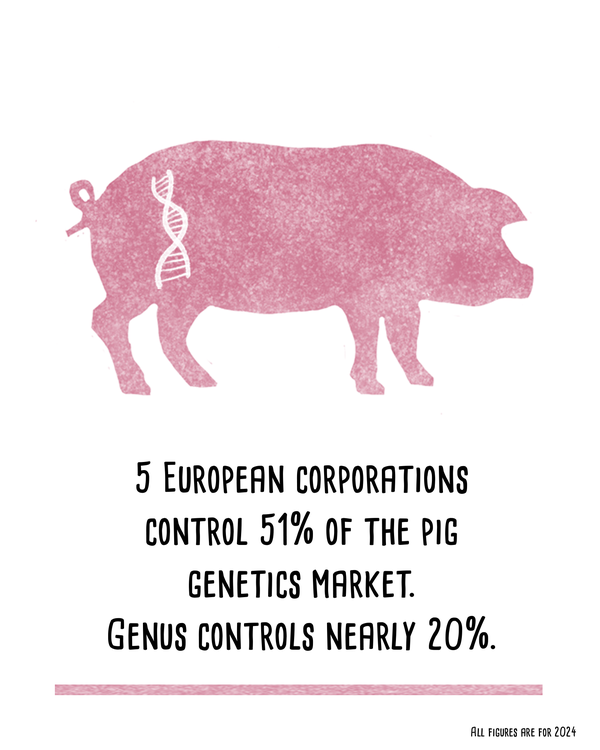
Table 6. Top 5 corporations in the pig genetics sector
| Ranking | Company (Headquarters) | Sales in 2024 (US$ millions) | % Global market share |
|---|---|---|---|
| 1 | Genus plc (UK) | 444 | 20 |
| 2 | Topigs Norsvin (Netherlands) | 325 | 15 |
| 3 | DanBred (Denmark) | 159 | 7 |
| 4 | Hendrix Genetics (Netherlands) | 139 | 6 |
| 5 | Axiom Group (France) | 54 | 2 |
| Total top 5 | 1,121 | 51 | |
| Total world market | 2,187 | 100 |
Shrimp production and trade have grown exponentially over the past 50 years. This growth has almost entirely occurred through the development and expansion of industrial farming of a few species of large shrimp for export in Asia and Latin America, particularly China, Ecuador, India, Vietnam and Indonesia. Farmed production focuses on penaeid shrimps, with Pacific white or vannamei shrimp accounting for 80 to 85%, followed by the giant tiger prawn (9%).
Shrimp farms are extremely vulnerable to diseases, and selection and breeding largely focuses on disease resistance. In Latin America, where shrimp farms are low-density and extensive, selection is done by exposing large populations to local pathogens and selecting survivors for grow-out. In Asia, where farms use a more intensive model based on smaller ponds and high stocking densities, selection is done in specialised, disease-free facilities and shipped as “Specific Pathogen Free” (SPF) broodstock to hatcheries for grow-out. In Latin America, selection tends to be carried out by the shrimp farming companies themselves and seed is much cheaper. In Asia, where SPF broodstock dominates, the market is increasingly controlled by a small number of multinational companies, most of them also involved in feed production and the livestock sector. The global shrimp SPF broodstock market was estimated at US$1.42 billion in 2024 (see Table 7).
Table 7. Top companies in farmed shrimp genetics
| Company (Headquarters) | Estimated market shares | Comments |
|---|---|---|
| Shrimp Improvement Systems (SIS) (US) | India (50%), Vietnam (40%), Indonesia (10-20%), China (5% of the imported broodstock market). | SIS is owned by a British Virgin Islands company that is alleged to be ultimately owned by Charoen Pokphand Foods (CP Group) or its owners, the Chearavanont family. It claims to be the major broodstock supplier for the Indonesian CP Prima, a subsidiary of CP Group. The company has broodstock production facilities in Hawaii and Florida (US), and a hatchery in Andhra Pradesh (India). |
| Hendrix Genetics (Kona Bay) (The Netherlands) | Indonesia (70%), India (6%). | The company operates nucleus breeding centres in Hawaii, broodstock multiplication centres in Indonesia, India and Thailand, and breeding facilities in Ecuador. |
| CP Group (Thailand) | Vietnam (15-20%), China (reported to be the main supplier of P. monodon hatcheries, but no figures available). | Its breeding facilities in Thailand supply South and Southeast Asia. It is also expanding breeding operations in the US to supply Indonesia, India, South and Central America and the EU. |
| SyAqua (Singapore) | India (33%), Indonesia (5%). | It is owned by Ocean 14 Capital. It has broodstock facilities in the US and Thailand. |
| Groupe Grimaud (Blue Genetics) | China (60% of the imported disease-tolerant and balanced lines). | It has facilities in Mexico and the US. |
| Guandong Haid Group | China (15% of the national shrimp seed market). | It is China’s largest aquafeed company, and has an aquaculture breeding and genetic programme. The company’s breeding division is called Hisenor. It has eight shrimp breeding centres in China, and in 2025 it acquired Indonesia’s only privately-owned SPF shrimp breeding facility, Global Gen. It also has hatcheries in Vietnam, Indonesia and Ecuador. Haid is also one of China’s largest feed companies for pigs and poultry. |
We need your help!
For over 25 years, Inf’OGM has been producing information, made freely available to everyone, on the artificialisation and appropriation of life (GMOs, NTGs, biotech, patents, etc.).
The monopolisation of a large share of public press subsidies by a few media groups reinforces the concentration of media ownership in the hands of a handful of businessmen. This concentration undermines the quality of information and democratic debate, which require a plurality of viewpoints.
In this context, alternative media outlets such as Inf’OGM, which receive no advertising revenue and provide information free of charge, need you – our readers – to continue to exist! Because, even when freely accessible, information comes at a cost.
Supporting Inf’OGM means working towards reliable, independent information on GMOs, biotechnology and seeds that is accessible to everyone.